


As a long-term stock trader, there’s one development in the stock market that takes me, and many others, to our collective knees. It’s a Volatility Index ($VIX) that rises past 20. There’s never been a bear market that’s unfolded with a VIX that remains below 20. FEAR is the common denominator in every bear market decline, besides the obvious price decline itself.
I’ve shown this VIX chart on many occasions, but now that we’ve seen the VIX soar since the Fed meeting, it’s certainly an appropriate time to remind ourselves of one simple market fact.
Stock market performance is at its absolute worst with a VIX above 20. Check out this chart:
This should at least open your eyes to the possibility of lower prices. These calculations date back to S&P 500 performance after April 10, 2013, the day that the S&P 500 cleared the double top from 2000 and 2007, confirming a new secular bull market was in place.
The rally since Monday’s opening bell has been nice, but there’ve been very few key resistance levels cleared. Early tests are here, or rapidly approaching, right now. Let’s look at a few key indices on an hourly chart. Many times, the declining 20-hour EMA provides solid near-term resistance, stopping the initial bullish wave in its tracks. Take a look:
S&P 500 ($SPX):
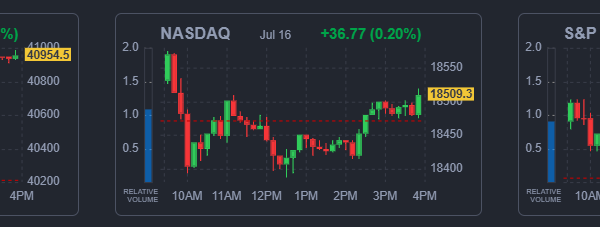
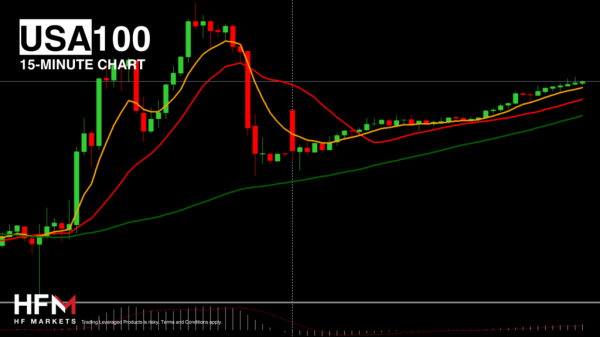
NASDAQ 100 ($NDX):
Semiconductors ($DJUSSC):
Failing at these key resistance levels doesn’t mean a bear market is underway. It simply increases the odds that the resistance levels provided will be difficult resistance to initially overcome. Likewise, a break through above key short-term resistance isn’t a precursor to new all-time highs around the corner. I’m simply watching these levels as a “piece” of the Q3 puzzle, trying to determine whether the odds of a further decline are increasing or decreasing.
9 days ago, I held a “Why the S&P 500 May Tumble” webinar, providing members with a ChartList of various price and economic charts they should watch in determining the likelihood of a big decline. That webinar paid off handsomely as our EB members were able to plan ahead for the increasing odds of a significant market decline. Now members, not too surprising, are asking in droves whether this is a pullback to buy back stocks cheaper, or if this is more likely to be a much deeper correction or even bear market that’s developing.
Clearly, these two choices are miles apart and getting this next step right will be the difference between a very painful Q3, one in which a lot of money might be lost, or setting up one of those “buying opportunities of a lifetime.”
I can’t answer all of our members’ questions one at a time, so late yesterday afternoon, I decided to host the obvious next step webinar, “HUGE Selling and Rising Fear: Pullback or CRASH??” This is a members-only event and it will begin at 4:30pm ET, just after today’s close. If you’re not a member, but would like to attend, we’ve got you covered. Simply CLICK HERE for more information and to register as a FREE 30-day trial member.
This is another HUGE event and I’d love to see you there!
Happy trading!
Tom


