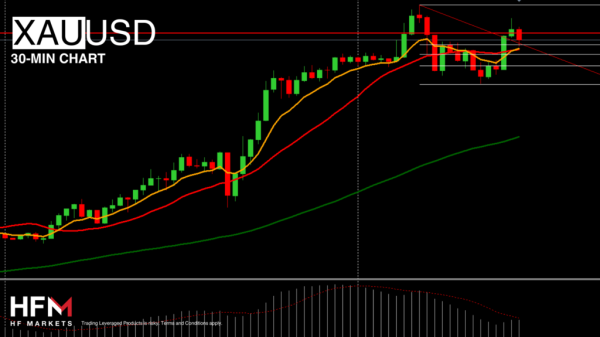
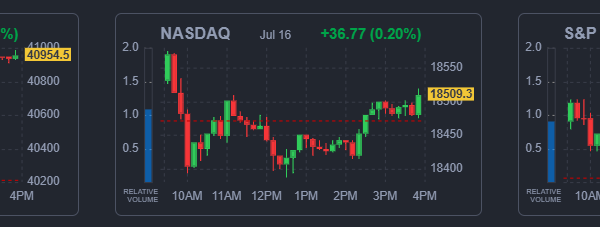
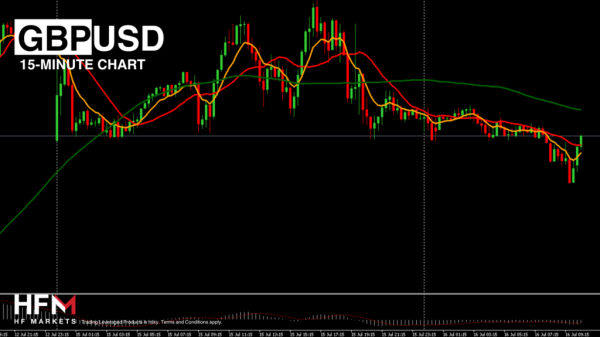
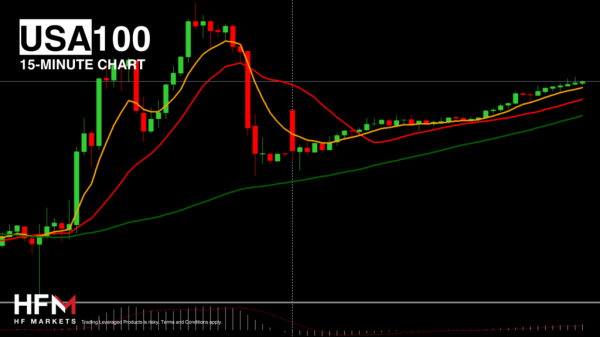
US stocks on Thursday moved lower, with tech stocks taking another hit, after META (-3.80%) warned about advertising revenue in an uncertain economic environment. Meanwhile, Alphabet (GOOGL) fell another -2.72% on Thursday, adding to Wednesday’s decline, as it reported disappointing cloud revenue. Amazon fell -1.11% in line with other tech stocks, but rallied back over +2%, after Thursday’s close, on a positive earnings report.
Amazon’s net sales jumped 13% y/y to reach $143.1 billion, surpassing analysts’ expectations. In the three months ended 30 September, net income skyrocketed 241% to $9.9 billion, with diluted earnings per share surging 235% to $0.94. In the reported period, operating income surged 348% compared to the same timeframe in 2022, amounting to $11.2 billion. On an annualised basis, Amazon Web Services segment sales grew 12%, reaching $23.1 billion.
The USA500 index fell -1.11% to end below the 4,200 mark, the USA30 fell -0.73% and the USA100 fell by -1.81% to its lowest level since May.
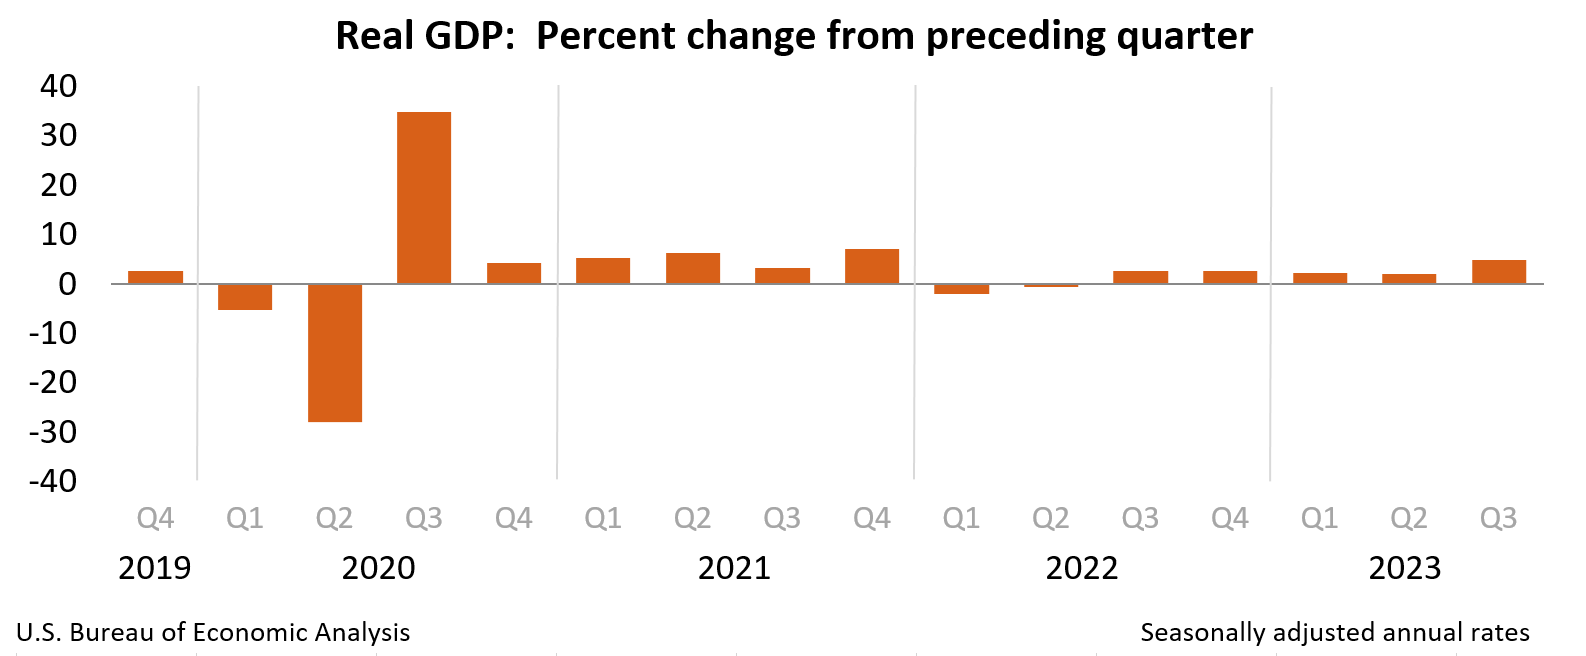
US GDP exceeds expectations with 4.9% growth in Q3
Perekonomian AS menunjukkan kinerja yang kuat di Q3 2023, dengan pertumbuhan GDP tahunan sebesar 4,9%, melampaui perkiraan sebesar 4,3% dan menunjukkan peningkatan yang nyata dari 2,1% yang terlihat di kuartal sebelumnya. Pertumbuhan GDP riil yang kuat ini didorong oleh serangkaian faktor, khususnya terdapat peningkatan yang nyata di berbagai bidang seperti belanja konsumen, investasi inventaris swasta, ekspor, belanja pemerintah negara bagian dan lokal, belanja pemerintah federal dan investasi tetap perumahan. Namun, peningkatan ini sedikit tertahan oleh penurunan investasi tetap non-perumahan. Selain itu, penting untuk dicatat bahwa impor, yang bertindak sebagai pengurang perhitungan GDP mengalami peningkatan selama periode ini.
The US economy performed strongly in Q3 2023, with annualised GDP growth of 4.9%, surpassing estimates of 4.3% and showing a marked improvement from the 2.1% seen in the previous quarter. This strong real GDP growth was driven by a series of factors, in particular there was a marked improvement in areas such as consumer spending, private inventory investment, exports, state and local government spending, federal government spending and residential fixed investment. However, these increases were slightly held back by a decline in non-residential fixed investment. In addition, it is important to note that imports, which act as a deduction from the GDP calculation saw an increase during this period.
The Fed’s Key Inflation Rate
The core PCE price index, excluding food and energy, rose by 2.4% annually in Q3, down from 3.7% in Q2.However, on closer inspection, core prices remained subdued, falling at an annualised rate of 2.1%.Starting late last year, Federal Reserve Chairman Powell shifted the focus of inflation to core PCE services, excluding housing, or superintendent services.This is in line with the Fed’s view that tight labour markets and rising wage growth are at the root of high inflation. Wages constitute a high percentage of costs for service businesses. Therefore, supercore services inflation should ease as wage pressures ease.
The supercore PCE inflation data in the third quarter showed price increases of 3.5% per annum, higher than in the second quarter. The data confirmed that the Fed still has a long way to go to bring down inflation for this expenditure category, which includes healthcare, haircuts and hospitality.
Initial claims for unemployment benefits rose by 10,000 to 210,000 in the week to 21 October. The four-week average of claims rose 1,250 to 207,500, near the lowest level in eight months. However, ongoing jobless aid claims rose 63,000 to 1.79 million, the highest since May.
The Commerce Department will release monthly inflation data for September on Friday, which is part of its personal income and spending report. Q3 data implies that supercore services inflation accelerated sharply in September, after weak figures in the previous two months.
Click here to access our Economic Calendar
Ady Phangestu
Market Analyst – HF Educational Office – Indonesia
Disclaimer: This material is provided as a general marketing communication for information purposes only and does not constitute an independent investment research. Nothing in this communication contains, or should be considered as containing, an investment advice or an investment recommendation or a solicitation for the purpose of buying or selling of any financial instrument. All information provided is gathered from reputable sources and any information containing an indication of past performance is not a guarantee or reliable indicator of future performance. Users acknowledge that any investment in Leveraged Products is characterized by a certain degree of uncertainty and that any investment of this nature involves a high level of risk for which the users are solely responsible and liable. We assume no liability for any loss arising from any investment made based on the information provided in this communication. This communication must not be reproduced or further distributed without our prior written permission.


